
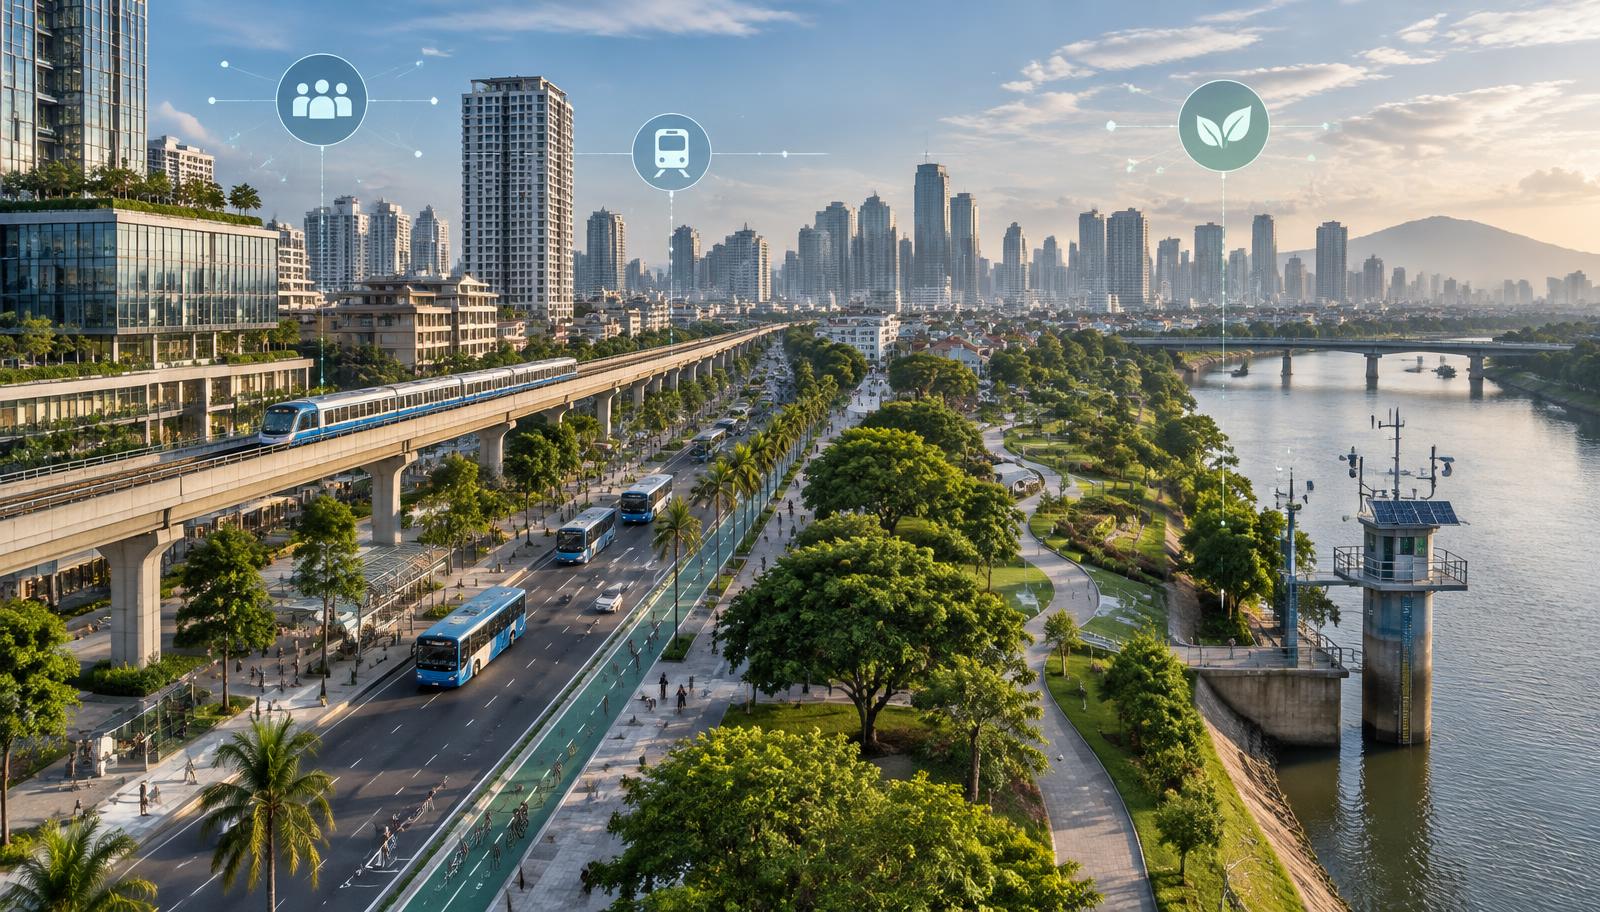
Philippine cities are being asked to do more with the same charter: digitize permits under the E-Governance Act, keep people moving without choking corridors, and prepare for floods that no longer respect old return periods. What they lack is a shared, city-level scoreboard that is honest about data gaps.
This Research article does two things—and keeps them separate on purpose.
- Methodology (v1.0 framework). It defines how SmartCity.ph intends to score all 149 Philippine cities across three pillars—Governance, Mobility, and Climate readiness—with indicators that are LGU-relevant, collectable, and aligned with DOST / ASEAN smart-city practice where that alignment is genuine.
- Pilot composite (public proxies). It scores a named subset of 16 cities using only public proxies we could verify in September 2026. That pilot is not the final Index.
Pilot composite (public proxies) — not final SmartCity.ph Index scores
The table and narrative below use a transparent, low-indicator public-proxy rubric. Scores are not SmartCity.ph Index v1.0 results. Cities absent from the pilot are not “behind”; most are simply invisible in currently published, city-comparable datasets.
Why an Index now
Three policy clocks are running at once.
- Digital government. RA 12254 (E-Governance Act, 2025) and its IRR push interoperable LGU services; DICT eLGU is the default pathway for many noncompliant units. Late-2025 DILG/DICT reporting cited 41 cities and 901 municipalities on eLGU—yet city-named public dashboards remain sparse.
- Mobility modernization. EDSA Busway is the country’s most mature high-capacity bus corridor; Cebu BRT began partial operations in March 2026; Davao’s bus modernization remains in build toward late-2020s operations. Documented active-transport delivery clusters in a few cities (Quezon City, Angeles, Iloilo, Marikina).
- Climate readiness. Quezon City (iRISE-UP), Cagayan de Oro (JICA–PAGASA FFWS), Davao (CDRA/MHEWS ordinances), Iloilo, and Marikina show documentable progress. Public evidence for most other cities is thin.
Oxford Economics’ Global Cities Index 2026 covers only nine PH cities (Manila 174th globally; then Angeles, Davao, Cebu, Bacolod, CDO, Dagupan, GenSan, Zamboanga). IMD-style products typically resolve to Manila alone. Useful for investors—not a 149-city LGU scoreboard.
Universe: 149 cities (confirmed)
FACT (PSA PSGC). As of 30 June 2026, the Philippine Statistics Authority’s Second Quarter 2026 Philippine Standard Geographic Code (PSGC) reports:
| Geographic level | Count |
|---|---|
| Highly Urbanized Cities (HUCs) | 33 |
| Independent Component Cities (ICCs) | 5 |
| Component Cities (CCs) | 111 |
| Total cities | 149 |
Also reported in the same PSGC update: 82 provinces, 1,493 municipalities, 42,010 barangays, and 18 regions. SmartCity.ph Index v1.0’s scoring universe is these 149 cities. Municipalities are out of scope for v1.0 (a future municipal layer may follow).
Interpretation. “149” is stable in recent PSGC releases; always cite the PSGC quarter and date when quoting the Index universe.
Three pillars and indicator families (v1.0)
Each pillar is scored 0–100. The Index aggregate is an equal-weight mean of the three pillars unless a later methodology note documents a change. Pillars map to SmartCity.ph’s editorial pillars and to themes common in DOST smart sustainable city work and ASEAN smart-city cooperation (digital government, urban mobility, climate/disaster resilience)—without claiming official endorsement.
Pillar A — Governance (digital + institutional)
Target: 5 indicators (v1.0 collection).
| Code | Indicator (LGU-relevant) | Ideal public / collectable source |
|---|---|---|
| G1 | Seal of Good Local Governance (SGLG) status, latest national cycle | DILG official awardee lists |
| G2 | End-to-end online business permitting (eBOSS or equivalent) | ARTA compliance lists; LGU portals |
| G3 | DICT eLGU / RA 12254 digital-service maturity | DICT city-level coverage; IRR maturity surveys |
| G4 | Open data / proactive transparency (machine-readable releases, FOI responsiveness) | City open-data portals; FOI metrics |
| G5 | Cybersecurity & service uptime basics for citizen portals | LGU self-report + DICT guidance |
Pilot used only G1–G2 (publicly verifiable for the subset).
Pillar B — Mobility
Target: 5 indicators.
| Code | Indicator | Ideal source |
|---|---|---|
| M1 | High-capacity transit serving the city (rail, Busway/BRT, or equivalent) | DOTr / operator maps; operational status |
| M2 | Protected / Class 2+ bike and walking network (km, recent delivery) | DOTr Active Transport; LGU inventories |
| M3 | Traffic management / ITS / signal or CCTV operations centers | LGU / MMDA (NCR context only) |
| M4 | Public-transport modernization (modern PUV corridors, depots, integrated payments) | DOTr / LGU project documents |
| M5 | First-/last-mile and PWD access standards on major corridors | LGU / audit surveys |
Pilot used only M1–M2.
Pillar C — Climate readiness
Target: 5 indicators.
| Code | Indicator | Ideal source |
|---|---|---|
| C1 | Flood / multi-hazard early-warning sensors and public alerting | CDRRMO; DOST-PAGASA; city platforms |
| C2 | CDRA mainstreamed into CLUP / LDIP / zoning practice | LGU ordinances; HLURB/DHSUD filings |
| C3 | Local Climate Change Action Plan (LCCAP) currency and budget link | CCC / LGU documents |
| C4 | Nature-based and heat interventions with monitored outcomes | LGU / DENR project M&E |
| C5 | Contingency finance and evacuation logistics readiness | DRRM plans; audit samples |
Pilot used only C1–C2 (where documented).
Scoring rules (v1.0 and pilot)
Scale
- Each indicator is scored on a 0 / 1 / 2 rubric (absent or failed / partial or in-progress / documented strong), then normalized to the pillar:
- Pillar score =
(sum of points on scored indicators ÷ (2 × number of scored indicators)) × 100
- Pillar score =
- Index composite (v1.0) = equal-weight mean of Governance, Mobility, and Climate readiness.
- Missing data: mark N/A; do not invent. If a pillar has no scored indicator, the pillar is N/A. For the pilot, a composite is published only when all three pillars have at least one scored indicator. No silent imputation in the pilot.
- Year of data (pilot): primarily CY 2024–Q3 2026 public materials retrieved September 2026. SGLG uses the CY 2024 national awarding cohort (December 2024 ceremonies).
What v1.0 still needs before a full 149-city release
- Primary LGU survey (digital services catalog, sensor inventories, bike-km, transit boardings).
- FOI requests to DICT (city-level eLGU status), ARTA (full eBOSS roster), DILG (machine-readable SGLG), DOTr (active-transport GIS).
- LGU self-report with evidence upload (portal URLs, ordinances, as-built plans).
- Optional third-party audits for a quality subsample.
- Clear cut-off date and revision policy (annual cycle recommended).
Limitations (apply to both framework and pilot)
- Public proxies favor large, English-documented, project-rich cities.
- National program mentions ≠ city delivery.
- SGLG is a broad governance seal, not a “smart city” certificate.
- NCR mobility benefits from legacy rail/Busway that component cities cannot replicate quickly—scores must be read with city class and metro context.
- Oxford / IMD figures are external context only and are not blended into SmartCity.ph pilot scores.
Pilot subset: who we scored and why
Sixteen cities were selected because they combine (a) Highly Urbanized City (or Dagupan as an Independent Component City in the Oxford PH set) status with (b) enough named, citable public evidence to score without fabrication:
Quezon City, Marikina, Pasig, Manila, Makati, Mandaluyong, Pasay, Taguig, Angeles, Bacolod, Cebu City, Davao City, Cagayan de Oro, Iloilo City, General Santos, Dagupan.
Excluded from the pilot (not from the future Index): the other HUCs and all remaining ICCs/CCs—roughly 133 cities—because city-comparable public proxies for two or more pillars were not verified in this research pass. Exclusion means data gap, not poor performance.
Pilot indicator rubric (public proxies)
| Code | 2 points | 1 point | 0 points |
|---|---|---|---|
| G1 SGLG CY2024 | Named on documented passer lists | — | Documented non-passer / not on verified passer lists for that city |
| G2 Digital permits | Documented full eBOSS (or equivalent end-to-end) | Partial automation documented | No public evidence reviewed |
| M1 Mass transit | Operational rail/Busway/BRT serving city | Partial ops or active construction with public timeline | No high-capacity corridor |
| M2 Active transport | City-specific 2024–26 delivery with km or funded project | National program mention only / early works | No evidence found → often N/A |
| C1 Flood EWS | Operational city sensor/alert platform documented | Agreement, pilot, or partial sensors | No evidence → N/A |
| C2 CDRA/LCCAP | Ordinance or institutionalization 2024–26 documented | Strategy mentions without full institutionalization | No evidence → N/A |
Pilot results table
Label reminder: Pilot composite (public proxies) — not final SmartCity.ph Index scores.
A. Cities with all three pillars scored (composite published)
| Pilot rank | City | Class | Governance | Mobility | Climate | Pilot composite |
|---|---|---|---|---|---|---|
| 1 | Quezon City | HUC | 100.0 | 100.0 | 100.0 | 100.0 |
| 2 | Marikina City | HUC | 100.0 | 75.0 | 100.0 | 91.7 |
| 3 | Pasig City | HUC | 100.0 | 100.0 | 50.0 | 83.3 |
| 4 | City of Manila | HUC | 100.0 | 75.0 | 50.0 | 75.0 |
| 5 | Davao City | HUC | 0.0 | 50.0 | 100.0 | 50.0 |
| 6 | Taguig City | HUC | 50.0 | 0.0 | 50.0 | 33.3 |
| 7 | Cagayan de Oro City | HUC | 0.0 | 0.0 | 75.0 | 25.0 |
B. Cities with incomplete pillar coverage (composite withheld)
| City | Class | Governance | Mobility | Climate | Why composite withheld |
|---|---|---|---|---|---|
| Makati City | HUC | 100.0 | 100.0 | N/A | Climate proxies not verified |
| Mandaluyong City | HUC | 100.0 | 100.0 | N/A | Climate proxies not verified |
| Pasay City | HUC | 100.0 | 100.0 | N/A | Climate proxies not verified |
| Angeles City | HUC | 100.0 | 50.0 | N/A | Climate proxies not verified |
| Bacolod City | HUC | 100.0 | 0.0 | N/A | Climate + richer mobility evidence thin |
| Cebu City | HUC | 0.0 | 50.0 | N/A | Climate proxies not verified |
| Iloilo City | HUC | N/A | 50.0 | 100.0 | SGLG/eBOSS city status not verified |
| General Santos City | HUC | 100.0 | 0.0 | N/A | Mobility/climate thin in sources reviewed |
| Dagupan City | ICC | N/A | 25.0 | 50.0 | Governance proxies not verified for 2024–26 |
The pilot results above are also maintained as a machine-readable research dataset by SmartCity.ph.
Narrative: who’s leading, who’s catching up — based only on the pilot table
Leading (full-composite leaders)
FACT. On this public-proxy pilot, Quezon City is the only city scoring 100 across all three pillars: CY2024 SGLG; NCR eBOSS coverage; extensive QC e-Services / open-data style platforms; EDSA Busway and MRT access; a funded DOTr Class 2 bike-lane package (₱121.45 million notice of award, January 2026); and the operational iRISE-UP calamity monitoring platform with 2025–2026 upgrades and awards.
Marikina and Pasig follow. Marikina combines SGLG + eBOSS with a mature river flood-alarm culture and DOTr active-transport recognition. Pasig matches strong governance and mobility (including SPARK/tactical-urbanism bike and walk work) but shows only partial climate-sensor documentation in the sources reviewed—hence a 50 climate pillar, not a climate lead.
Manila remains strong on governance and high-capacity transit legacy, with thinner city-specific active-transport and climate-sensor citations than QC/Marikina in this pass.
Interpretation. “Leading” here means best-documented public-proxy stack, not proven superiority on unpublished operational metrics (on-time buses, actual open-data reuse, sensor uptime).
Catching up (full-composite)
Davao City is the clearest catch-up / uneven profile story in the full-composite set: climate 100 on the back of October 2025 ordinances institutionalizing CDRA and a multi-hazard early-warning handbook, mobility at 50 while the Davao bus modernization project is still in build (public timelines point to late-2020s operations), and governance at 0 on G1 because Davao City was not located on CY2024 SGLG passer lists reviewed (it did publicize Seal of Good Financial Housekeeping—related, but not SGLG).
External context (not in pilot scores): Oxford Economics 2026 places Davao third among nine PH cities (470th globally; reported overall 42.6, environment 71.6) and lists it among “Emerging Standouts”—useful context, not blended into this pilot.
Taguig and Cagayan de Oro illustrate opposite gaps. Taguig is eBOSS-covered with a 2026 PAGASA/KOICA flood-sensor agreement (scored partial on C1) but was not among NCR’s 14 CY2024 SGLG passers and lacks verified Busway/LRT/MRT stations in-city for M1. CDO’s JICA–PAGASA Flood Forecasting Warning System (inaugurated April 2025) drives a solid climate pillar, while local reporting documented a failed SGLG 2024 bid and no high-capacity transit proxy.
Incomplete coverage — do not over-read
Makati, Mandaluyong, and Pasay score high on governance + Busway/rail but have N/A climate—so no composite. Angeles pairs back-to-back SGLG with 11.1 km of DOTr Class 2 bike lanes (May 2026) without verified climate proxies here. Cebu City gets mobility 50 from partial CBRT (March 2026) and governance 0 on SGLG (Danao and Bogo were the Cebu island city passers in reviewed 2024 reporting). Iloilo City documents strong sensors and ₱74 million DOTr bike hubs, but city-level SGLG/eBOSS status was unverified in sources reviewed.
The real headline: mid-size invisibility
FACT. DICT/DILG talk about hundreds of LGUs on eLGU, yet this research could not assemble a city-named national eLGU roster for scoring. ARTA reports 127 fully automated LGUs nationally (April 2026) and near-complete NCR eBOSS compliance except Pateros—but again without a public, stable city spreadsheet for all 149 cities.
Interpretation. Until DICT, ARTA, DILG, and DOTr publish city-level machine-readable coverage files, any “national smart city ranking” built only from press clips will systematically over-represent Metro Manila HUCs and a few Visayas/Mindanao project cities—and leave most component cities unscored. That is a data infrastructure problem before it is a city performance problem.
How to use this — and the bottom line
LGUs should treat the methodology as an evidence checklist (portals, SGLG docs, sensor inventories, bike GIS, CDRA/LCCAP)—not a rebuttal to a non-final pilot. Operators can target documented pillar gaps (eBOSS outside NCR; flood EWS; protected bike delivery). National agencies can unlock the real 149-city Index by publishing city-level open CSVs for eLGU, eBOSS, SGLG, and active-transport km.
Bottom line: the v1.0 framework covers all 149 cities; this pilot scores 16 and publishes composites for seven. Quezon City, Marikina, and Pasig lead that fully scored set; Davao shows the sharpest asymmetry (climate strong, SGLG proxy weak, transit still building). The unscored majority needs better public data, not a fabricated rank.
Editor’s note (sourcing, exclusions, path to 149)
Pilot indicator sources (URLs / citations)
Universe / legal
- PSA PSGC LGU counts as of 30 June 2026 (Q2 2026 PSGC) — PSA public communications / PSGC portal: https://psa.gov.ph/classification/psgc
- RA 12254 text: https://www.lawphil.net/statutes/repacts/ra2025/ra_12254_2025.html
Governance
- DILG-NCR: 14 NCR LGUs CY2024 SGLG passers (Caloocan, Las Piñas, Makati, Malabon, Mandaluyong, Manila, Marikina, Muntinlupa, Navotas, Pasig, San Juan, Valenzuela, Quezon City, Pasay): https://ncr.dilg.gov.ph/ (SGLG 2024 feature page retrieved Sep 2026)
- Angeles City SGLG 2024: https://www.angelescity.gov.ph/view_news?newsID=8bcaf22d8fcc4aaef0ad0a2cf773712c0700
- Bacolod SGLG 2024: https://www.sunstar.com.ph/bacolod/bacolod-receives-sglg-award
- Cebu island SGLG 2024 city passers (Danao, Bogo—not Cebu City): https://www.philstar.com/the-freeman/cebu-news/2024/11/15/2400367/2-cities-12-towns-cebu-bag-sglg-award
- Davao City SGFH 2024 (not SGLG): https://davaocity.gov.ph/local-government/davao-city-is-2024-seal-of-good-financial-housekeeping-passer/
- CDO non-SGLG 2024 (local radio reporting): https://cdo.bomboradyo.com/sglg-award-pakyas-makuha-sa-cdeo-lgu-ning-tuiga/
- GenSan SGLG 2024: attributed via PIA Region 12 release https://pia.gov.ph/press-release/lgus-in-region-12-shine-at-sglg-awards-2024/ (page Cloudflare-challenged at retrieval; confirm against DILG master PDF)
- ARTA eBOSS: NCR all LGUs except Pateros fully compliant; 127 LGUs fully automated nationally — BusinessWorld, 5 Apr 2026: https://bworldonline.com/economy/2026/04/05/740841/70-more-local-government-units-expected-to-automate-permit-systems/
- eLGU scale (41 cities / 901 municipalities in cited DILG/DICT release): https://pia.gov.ph/press-release/more-than-900-lgus-go-digital-faster-easier-services-within-reach-through-elgu-system/
- QC e-Services / open platforms: https://quezoncity.gov.ph/program/qc-eservices/ ; https://quezoncity.gov.ph/qc-govt-boosts-transparency-accountability-with-qcitizen-data-platforms/
Mobility
- EDSA Busway: public route guides (Caloocan, QC, Mandaluyong, Makati, Pasay, Parañaque). CBRT partial ops 13 Mar 2026: https://www.philstar.com/the-freeman/cebu-news/2026/03/13/2514019/cbrt-starts-partial-operations-today . Davao PT modernization (2026): https://bworldonline.com/economy/2026/09/01/773920/davao-transport-modernization-on-track-dotr/
- QC bike lanes ₱121.45M: https://www.philstar.com/nation/2026/01/08/2499466/dotr-awards-p121-million-deal-quezon-city-bike-lanes ; Angeles 11.1 km: https://www.sunstar.com.ph/pampanga/local-news/dotr-lgu-expand-active-transport-infra-in-angeles ; Iloilo ₱74M hubs: https://www.dailyguardian.com.ph/blog/iloilo-city-breaks-ground-on-php-74m-bike-mobility-hubs ; Pasig SPARK/IKI assessments 2025–26; DOTr ~1,100 km nationwide: https://tribune.net.ph/2026/05/20/dotr-hits-nearly-half-of-2028-bike-lane-goal
Climate
- QC iRISE-UP: https://quezoncity.gov.ph/program/irise-up-real-time-calamity-monitoring-system/
- Davao CDRA + MHEWS ordinances (30 Oct 2025): https://www.sunstar.com.ph/davao/sp-approves-disaster-prevention-measures
- CDO FFWS inauguration (4 Apr 2025): https://www.jica.go.jp/english/overseas/philippine/information/press/2025/CDOFFWS20250404.html
- Iloilo hazard sensors: https://cdrrmo.iloilocity.gov.ph/projects/hazard-sensors/
- Taguig–PAGASA flood warning systems agreement (Jun 2026 reporting): https://mb.com.ph/2026/06/06/taguig-to-install-flood-warning-systems
- Marikina river alarm / sensor practice: long-standing public DRRM guidance plus 2025 sensor-pilot reporting with Pasig
External context only (not in pilot math)
- Oxford Economics Global Cities Index 2026 PH ranks via SunStar Davao (20 Sep 2026): https://www.sunstar.com.ph/davao/davao-city-rises-to-no-3-in-ph-470th-globally-in-oxford-index — Manila 174; Angeles 388; Davao 470; Cebu 474; Bacolod 504; CDO 530; Dagupan 620; GenSan 818; Zamboanga 823. Davao overall score 42.6; environment 71.6 (as reported).
Cities excluded and why
- ~133 other cities (remaining HUCs, ICCs Naga/Ormoc/Santiago/Cotabato, and all other component cities): insufficient multi-pillar public proxies verified in this pass—not a judgment of performance.
- Zamboanga City: in the Oxford PH set, but CY2024 SGLG and mobility/climate proxies were not verified here.
- Parañaque: appears on EDSA Busway maps but was outside this 16-city coding cut (also not among NCR’s 14 CY2024 SGLG passers).
Must-collect for full 149
- DILG machine-readable SGLG passer/non-passer file by city, multi-year.
- ARTA eBOSS full/partial/noncompliant roster by city.
- DICT eLGU go-live status by city + RA 12254 maturity survey microdata.
- DOTr active-transport GIS (bike km by city) and transit operations status.
- Standardized CDRRMO survey: sensor counts, alert channels, last drill date.
- CDRA/CLUP/LCCAP document register with adoption dates.
- Optional: citizen experience panel (permit time, commute time, alert trust).
FACT vs INTERPRETATION discipline
- Numbers tied to URLs above = FACT (sourced).
- Phrases such as “leading,” “catching up,” “invisible,” and “data infrastructure problem” = INTERPRETATION of the pilot table and gap pattern—not Independent Index law.